Dashboard: Usage
The Usage page provides aggregate analytics, per-model performance breakdown, and per-request logs across all projects. Use it to understand spending patterns, investigate errors, and drill into individual request traces.
Summary Statistics
The top row shows aggregated totals for the selected filter set:
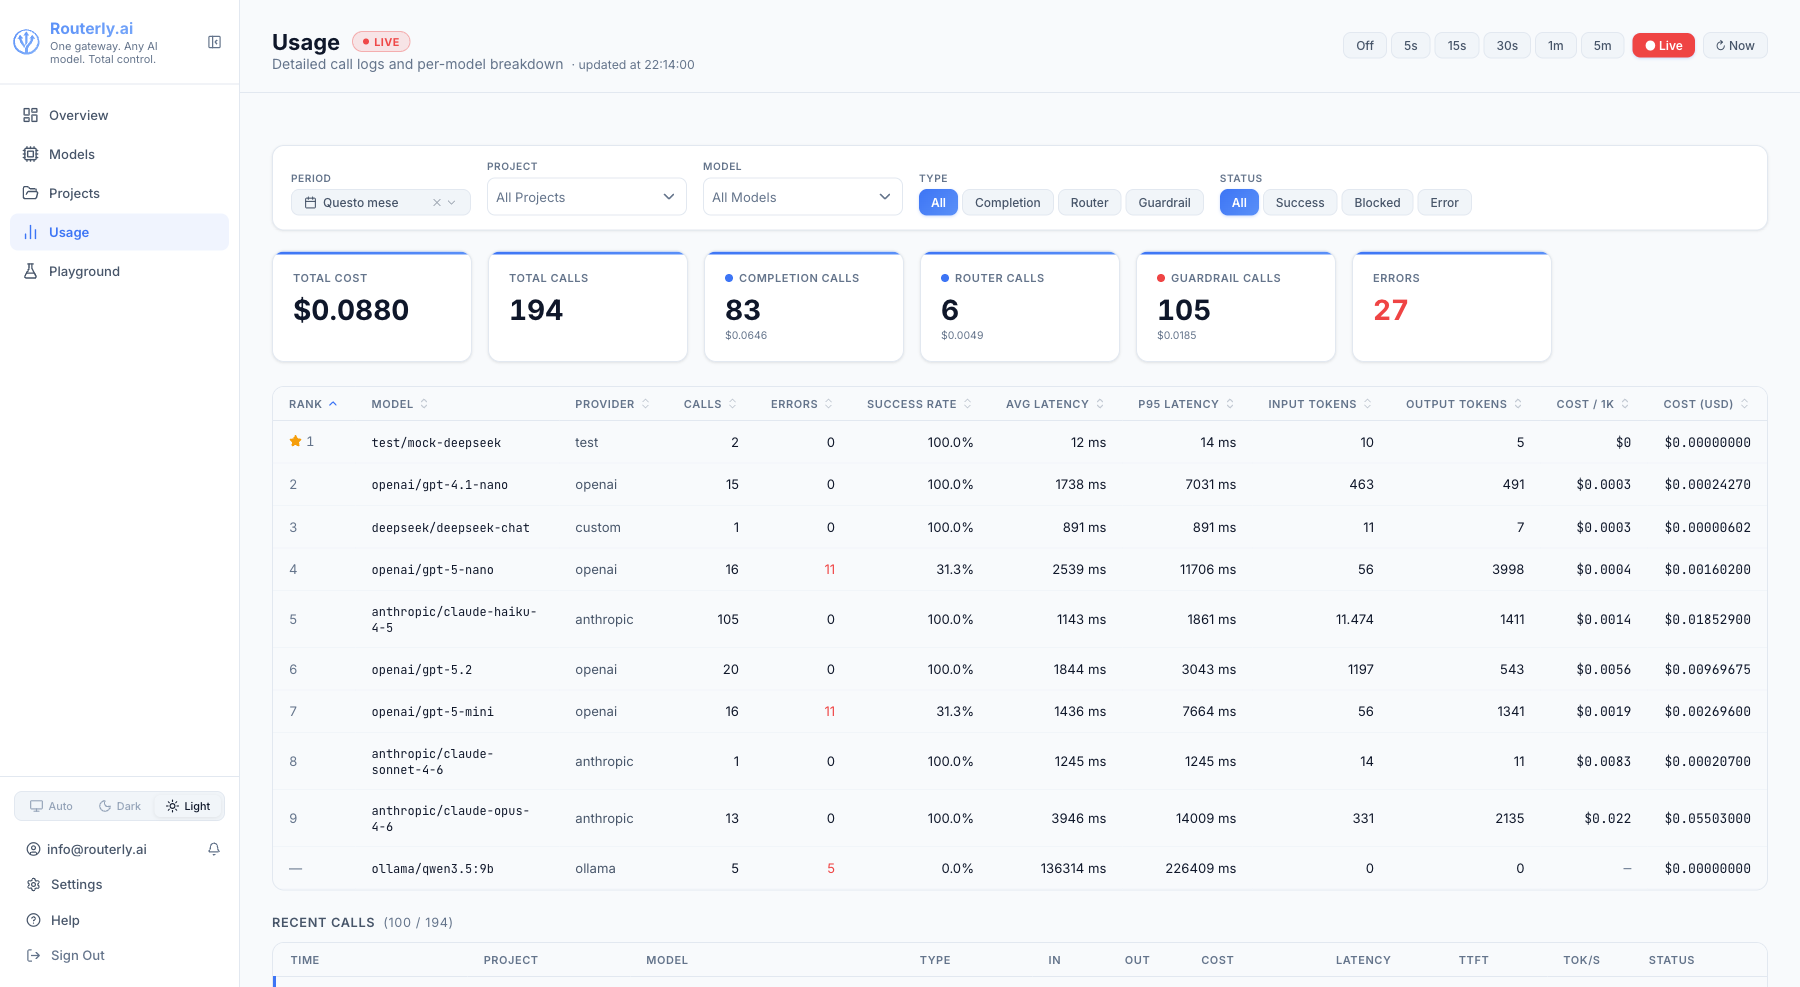
| Card | Description |
|---|---|
| Total Cost | USD cost of all successful calls in the period |
| Total Calls | All usage records (completion + routing + guardrail + blocked) |
| Completion Calls | Main model inference calls, with their total cost |
| Router Calls | LLM routing policy calls (e.g. the llm routing policy), with cost |
| Guardrail Calls | Model calls made by security rules (semantic, topic, moderation), with cost |
| Blocked Calls | Requests blocked by a guardrail rule before reaching any model. Shown only when at least one blocked call exists in the period. |
| Errors | Failed model calls -- blocked calls are counted separately and excluded from this number |
Guardrail judge calls are charged to the project like any other model call and are subject to the project's budget limits. Blocked requests record zero cost and zero tokens.
Filters
| Filter | Description |
|---|---|
| Period | Preset time window (today, this month, etc.) or custom range |
| Project | Filter to a specific project |
| Model | Filter to specific model IDs |
| Type | All, Completion, Router, or Guardrail -- filters by call sub-activity type |
| Status | All, Success, Blocked, or Error -- Blocked shows only guardrail-blocked requests |
| Session ID | Filter to requests from a specific session (from the x-routerly-conversation-id header) |
| Tags | Filter by token metadata (e.g., environment: production) |
Filters are applied immediately and affect the summary cards, the per-model breakdown table, and the request log simultaneously.
Use the Session ID filter to view all requests from a specific conversation or user session. Use the Tags filter to analyze traffic by team, environment, application, or any custom dimension you tag your tokens with.
Per-Model Breakdown
Below the summary cards, a table ranks all models that received traffic in the selected period.
| Column | Description |
|---|---|
| Model | Provider model identifier |
| Provider | Provider name |
| Calls | Total requests in the period |
| Errors | Failed calls |
| Success Rate | Percentage of successful completions |
| Avg Latency | Mean response time |
| P95 Latency | 95th-percentile response time |
| Input Tokens | Total input tokens consumed |
| Output Tokens | Total output tokens produced |
| Last Used | Timestamp of the most recent call |
| Total Cost | Total spend for this model in the period |
A star marks the model with the best cost-performance ratio based on your own traffic. The table respects all active filters.
The standalone Leaderboard page has been merged into this page. /dashboard/leaderboard redirects to /dashboard/usage.
Usage Table
The table lists individual requests with:
| Column | Description |
|---|---|
| Timestamp | When the request arrived |
| Project | The project the request belonged to |
| Model | Provider model used |
| Type | API type (chat, responses, messages) |
| Status | Outcome |
| Input Tokens | Input token count |
| Output Tokens | Output token count |
| Cost | Estimated cost in USD |
| Latency | Time to first byte / total response time |
The Status badge in the table uses colour coding:
| Outcome | Badge colour |
|---|---|
success | Green |
blocked | Amber |
error / other | Red |
Click any row to open the full Trace view.
Trace View
The trace view shows the complete lifecycle of a single request:
- Router Request -- the routing engine's input: the project slug, requested model (if any), and active policies
- Router Response -- which model was selected and why (policy scores listed)
- Model Request -- the actual payload sent to the provider
- Model Response -- the raw provider response including all tokens and finish reason
The trace also includes guardrail and PII entries when those features are active:
| Trace entry | When |
|---|---|
guardrail:evaluated | After every guardrail check -- shows each rule's outcome (passed, triggered, or skipped) and reason, even when no rule fires |
guardrail:triggered | A request-side rule matched with log action (request continued) |
guardrail:response-triggered | A response-side rule matched with log action (response continued) |
pii:scrubbed | PII was detected and replaced in the request or response |
For a blocked request (judged rule that triggers), the trace includes the guardrail:evaluated entry and the block message (from the judge's reason field, or a built-in default if the judge fails). The block message is stored on the trace only and is not included in the wire response sent to the client.
The detail panel for each usage record shows:
| Field | Description |
|---|---|
| Guardrail Triggered | Identifier of the first rule that fired (e.g. regex:pattern, injection:dan-mode, topic:gpt-4o-mini) |
| Blocked By | Same as Guardrail Triggered -- present only when outcome is blocked |
| PII Redacted | Comma-separated list of entity types redacted (e.g. EMAIL, PHONE) |
| Session ID | Session identifier from the x-routerly-conversation-id header, if provided (useful for grouping multi-turn conversations or user sessions) |
| Tags | Custom metadata from the token that made the request (e.g., environment: production, team: backend); enables filtering and analysis by custom dimensions |
Live Polling
The page starts in Live mode, which refreshes every 2 seconds. A red pulsing badge appears next to the page title while Live is active.
To change the refresh interval, click any option in the interval selector directly. Doing so automatically exits Live mode and applies the selected interval:
| Interval | Meaning |
|---|---|
| Live | Refresh every 2 seconds (default on page load) |
| Off | Manual refresh only (click the refresh button) |
| 5 s | Refresh every 5 seconds |
| 15 s | Refresh every 15 seconds |
| 30 s | Refresh every 30 seconds |
| 1 min | Refresh every minute |
| 5 min | Refresh every 5 minutes |
The Period filter (date range picker) works independently of Live mode. You can change the displayed time window at any time, even while Live polling is active, without turning it off first.
Exporting Usage Data
Usage data is stored in ~/.routerly/data/usage.json as newline-delimited JSON. You can process it with any standard tool:
# Total cost this month
cat ~/.routerly/data/usage.json | \
  jq -r 'select(.timestamp | startswith("2025-07")) | .cost' | \
  awk '{sum+=$1} END {printf "Total: $%.4f\n", sum}'
For programmatic access, use the Usage API.