Dashboard: Playground
The Playground lets you send chat requests directly from the browser without writing any code. It is useful for testing models, verifying routing behaviour, and debugging prompt changes.
Getting Started
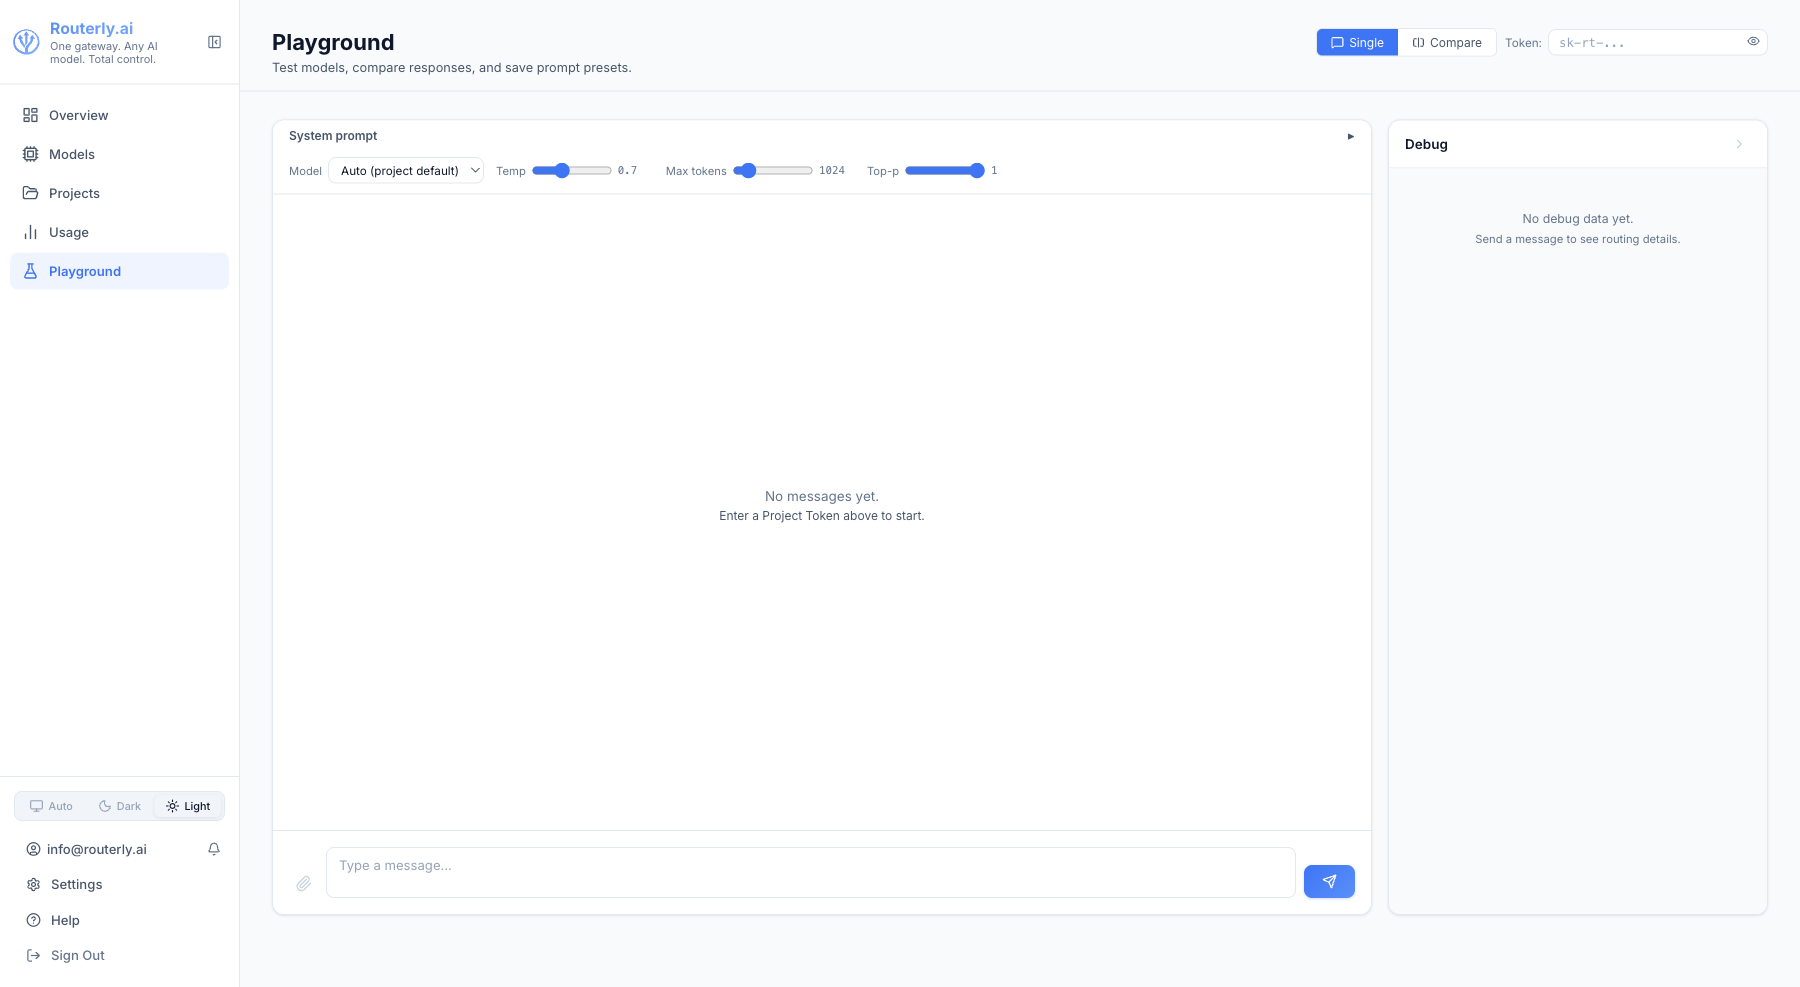
- Open Playground from the sidebar
- Enter a Project Token in the Token field (top right): paste an
sk-rt-...token from any project you have access to - Type a message in the input box at the bottom and press Send (or
Enter)
Interface
Message History
Messages are displayed in a conversational thread. Each message shows:
- The role (
user/assistant) - The content (with Markdown rendering for assistant responses)
- For image inputs: a thumbnail
The conversation history is maintained for the duration of the browser session and sent with each request as messages context.
Mode
Use the Single / Compare toggle (top right) to switch between a single-model chat and a side-by-side comparison view.
Model Display
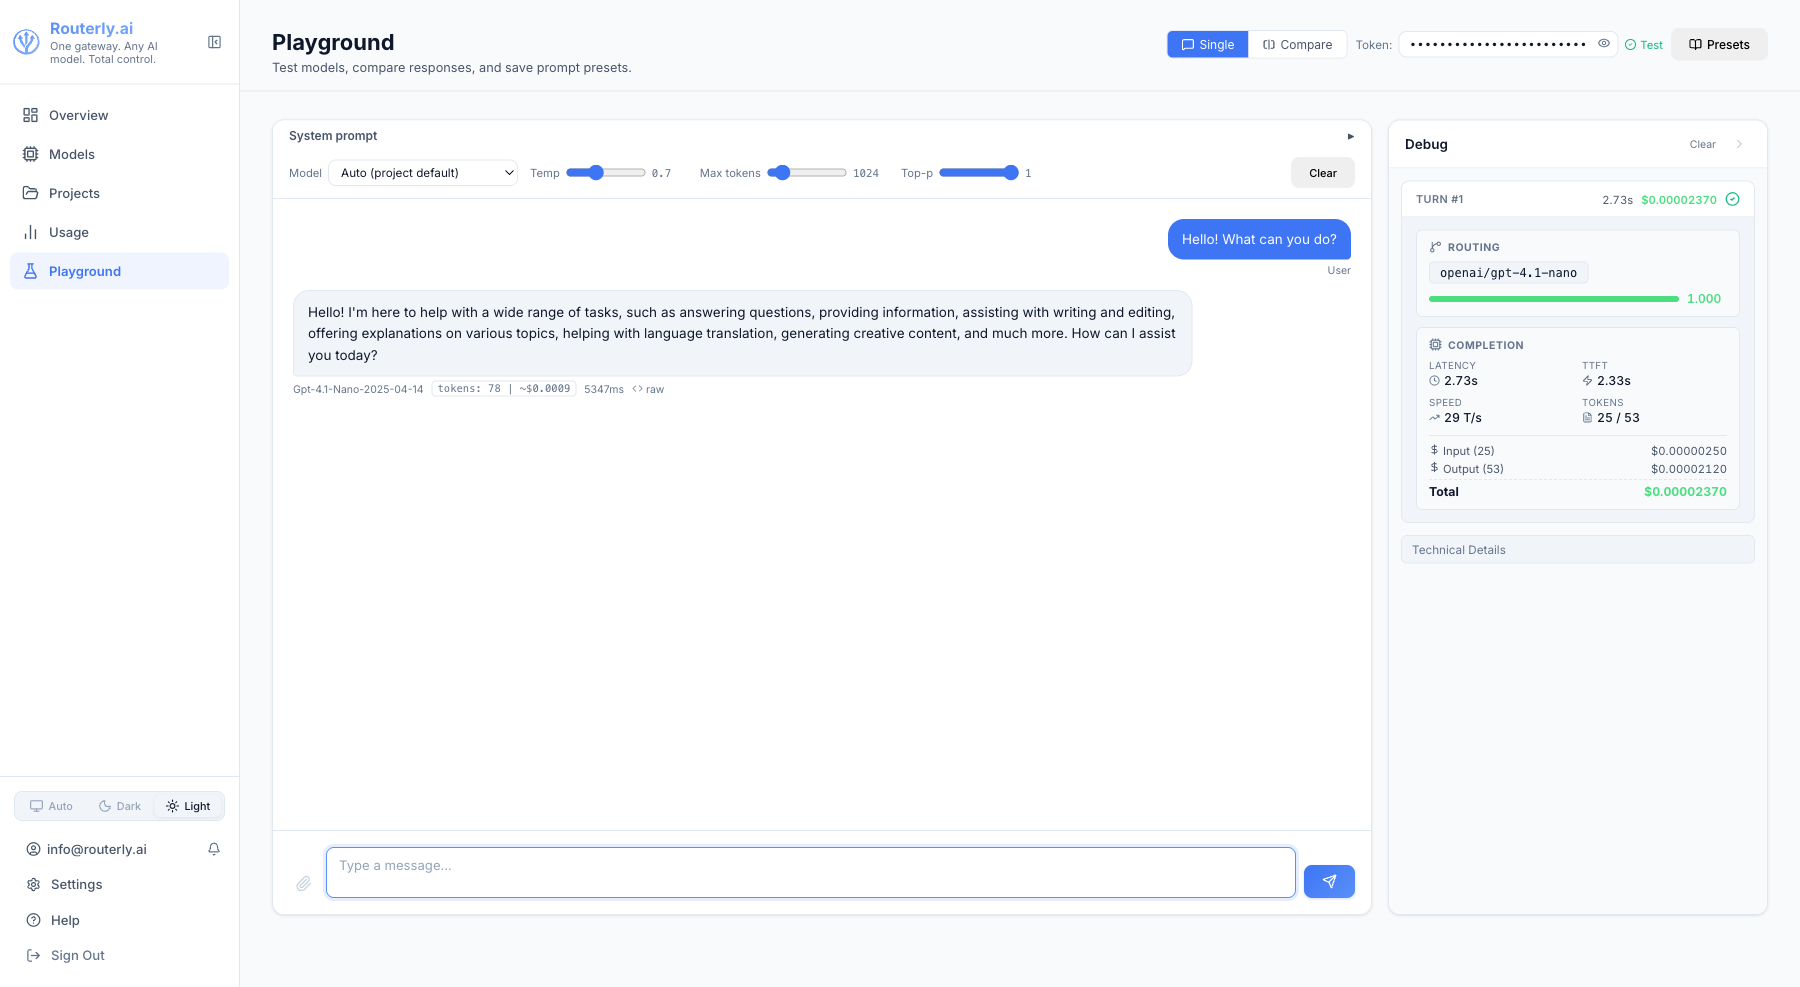
The model actually used is shown above each assistant response. If routing assigned a different model than expected, this is where you'll see it.
Streaming
Responses stream in real time when the selected project's routing configuration supports streaming. A stop button (⏹) appears while a response is in progress - click it to abort.
Streaming disabled notice: When the project has one or more guardrail rules that judge responses (Response flag enabled), streaming is automatically disabled because the entire response must be buffered before the block decision is made. You will see a banner at the top of the chat area explaining this, and the stream toggle will be disabled.
Image Attachments
Click the Attach Image button (or paste an image) to include image content in your message. This requires the routed model to have the vision capability.
Guardrail Block Indicator
When a judged guardrail rule (topic/moderation with Request or Response flag) triggers, the block message is displayed as a normal assistant message in the chat (not a red box). The message shown is the judge model's own explanation, in the same language as the user's latest message. If the judge fails or returns no explanation, a built-in default is used.
The wire response seen by your application is a standard finish_reason: "content_filter" (OpenAI) or stop_reason: "refusal" (Anthropic) HTTP 200 response, not an error. Empty content is returned. The Playground displays the block message here for convenience, but it is stored only in the trace, not in the wire response sent to API consumers.
Debug Panels
The Debug sidebar (right side of the screen) shows one collapsible section per conversation turn. Expand a turn to see:
| Panel | Contents |
|---|---|
| Turn summary | Model used, token counts, latency, and guardrail judge tokens/cost when a topic or moderation judge ran |
| Technical Details | Full routing trace: policy scores, selected model, guardrail evaluation, PII scan results |
These panels are invaluable for understanding why the router chose a specific model, diagnosing provider errors, or confirming that guardrails and PII scrubbing fired correctly.
Blocked turns: when a guardrail blocks the request there is no model completion, so the Turn summary shows a red Guardrail Blocked card instead of the usual completion metrics. The card reports the guardrail judge tokens (input/output) and their estimated cost, so a blocked turn is never empty. The specific rule that fired is listed under Technical Details.
Guardrails Evaluated
When guardrails are configured on the project, the Technical Details section shows GUARDRAILS EVALUATED (REQUEST) and/or GUARDRAILS EVALUATED (RESPONSE) blocks after every request, whether or not any rule fired. Each row represents one rule that ran:
| Column | Meaning |
|---|---|
| Rule name | The rule identifier from your guardrail config, e.g. regex:pattern, semantic, topic, or Prompt injection for the built-in injection detector |
| Outcome chip | passed (green): the rule ran and did not match. triggered (red): the rule matched and is logged/blocking. skipped (grey): the rule did not run, e.g. its judge model was unavailable. |
| Reason | Shown below the rule name on skipped or scored rules, e.g. judge-failed, semantic:82%, moderation:score=0.94 |
| Judge response | (collapsible, model-judge rules only) Shows the judge model's raw response and the parsed JSON (reason and score). Useful for debugging why a rule scored a certain way. |
The Prompt injection row represents the built-in injection detector. It is enabled per project via the Detect Injection toggle on the project Security tab or via routerly project guardrails.
Use this block to answer: "Did the guardrail rule run? Did it match? Which actions were taken (block, log, or both)?"
PII Scanned
When PII scrubbing is active, the Technical Details section always shows a PII SCANNED (REQUEST) and/or PII SCANNED (RESPONSE) block, even when nothing was redacted. This confirms that scrubbing ran.
| State | Display |
|---|---|
| Nothing redacted | 0 redacted (clean) |
| Entities redacted | N redacted with entity-type pills, e.g. EMAIL, PHONE_NUMBER |
When entities were redacted, a separate PII SCRUBBED block (orange) also appears listing the replaced entity types.
All trace data is fetched out-of-band via the trace store using the x-routerly-trace-id response header. The wire response returned to your application is never modified to include trace information.
Clearing the Conversation
Click Clear to reset the message history. The system prompt (if any) is preserved.
Limitations
- The Playground does not save conversations after a page refresh.
- Function-calling / tool-use responses are shown as raw JSON.
- Audio and document inputs are not supported via the Playground UI.