Overview
The Overview page is the dashboard home screen. It shows a snapshot of activity across all projects for the selected time period.
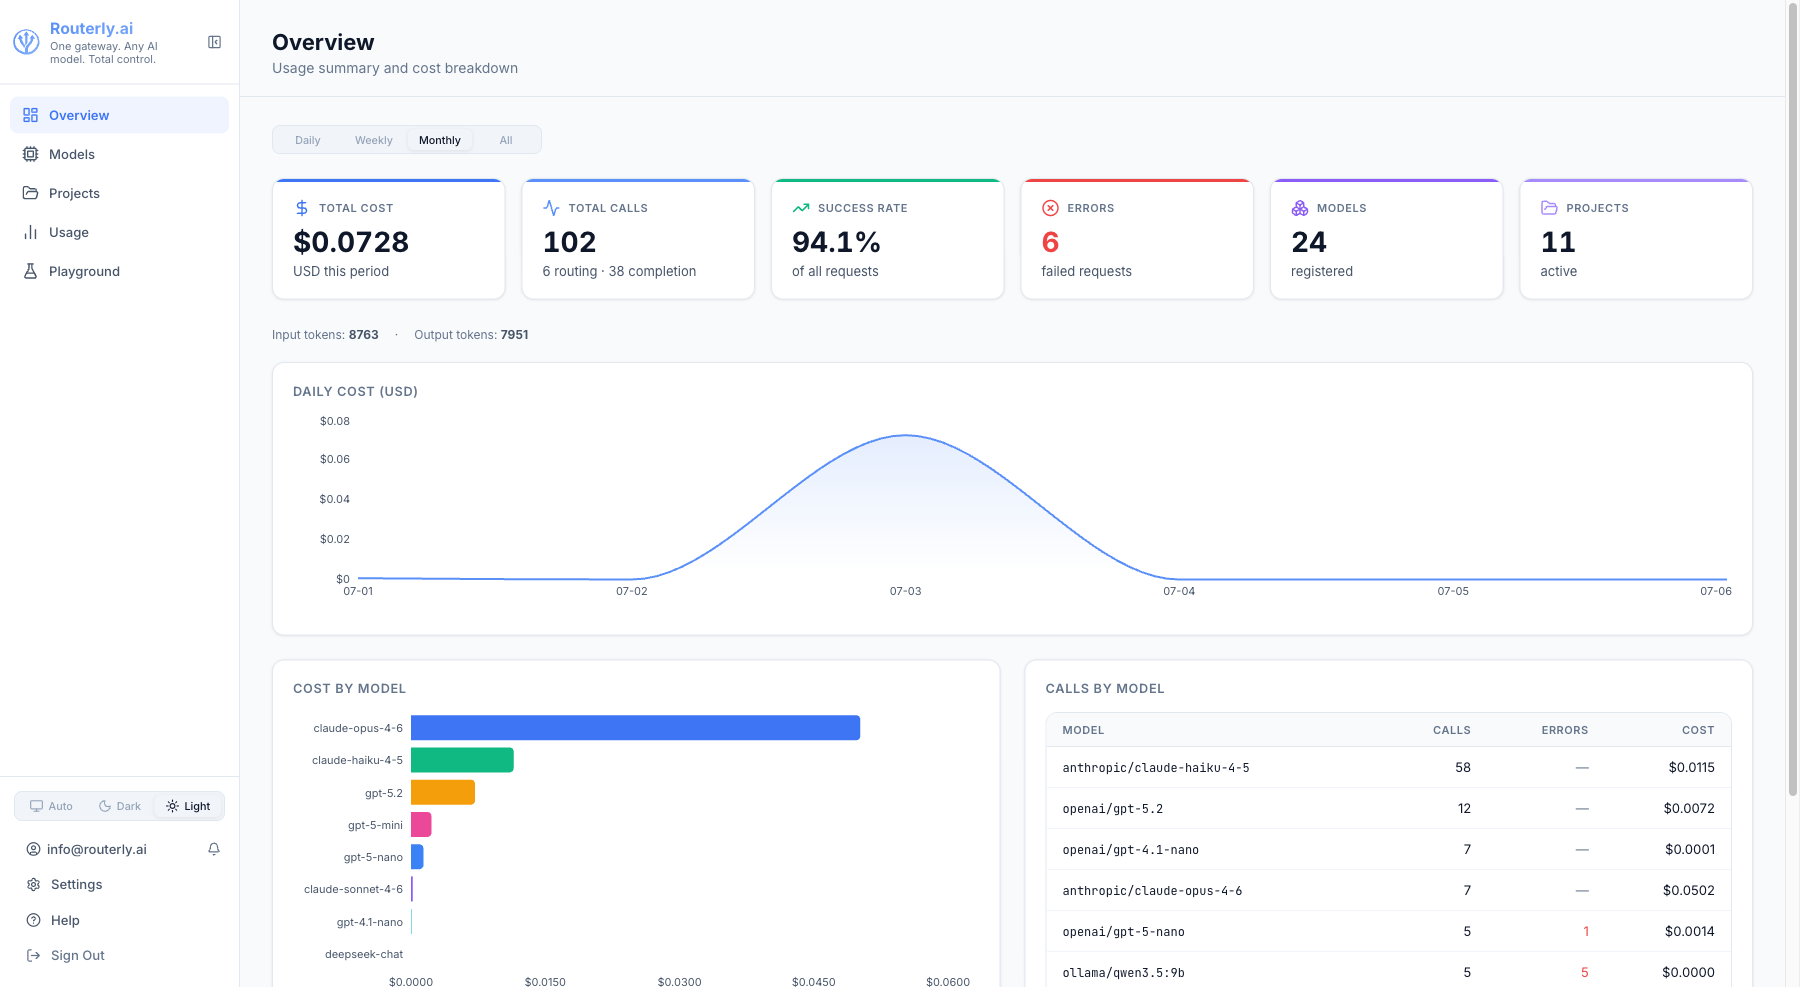
Period Selector
A segmented control at the top of the page switches between four reporting windows:
| Option | Description |
|---|---|
| Daily | Today, broken down by hour (00:00–23:00) |
| Weekly | Current calendar week (Monday–Sunday) |
| Monthly | Current calendar month |
| All | All recorded activity |
The entire page — cards, charts, and tables — updates instantly when you switch periods.
Summary Cards
The top row shows aggregate numbers for the selected period:
| Card | Description |
|---|---|
| Total Cost | Sum of all LLM costs in USD |
| Total Calls | Number of API requests, with a routing vs. completion breakdown in the sub-text |
| Success Rate | Percentage of requests that returned a successful response |
| Errors | Number of failed requests (provider errors, budget exceeded, and so on) |
| Active Models | Number of models that received at least one call |
| Active Projects | Number of projects with at least one call |
Token Strip
Below the summary cards, a strip shows aggregate token counts for the period:
| Metric | Description |
|---|---|
| Input tokens | Total prompt tokens sent to providers |
| Output tokens | Total completion tokens received |
| Cached tokens | Tokens served from the provider's prompt cache (counted at the reduced cached rate) |
Cost Over Time Chart
A bar chart shows cost over time for the selected period. The chart adapts its granularity to the selected window:
- Daily — one bar per hour of the current day
- Weekly / Monthly — one bar per day; days with no activity show a zero bar (no interpolation)
- All — one bar per day across the full history
Only models with non-zero cost appear in the legend. Bars are sorted by total cost descending.
Calls by Model Table
A table below the chart breaks down activity per model for the selected period:
| Column | Description |
|---|---|
| Model | Model ID as registered in Routerly |
| Calls | Total requests routed to this model |
| Errors | Number of failed requests for this model |
| Cost | Total cost in USD |
Rows are sorted by call count descending.
Navigating to Details
- Use the Usage item in the sidebar for the full analytics page with filtering and drill-down by project, model, or date range.
- Click a project name in the sidebar to go directly to that project's configuration.