Dashboard: Settings
The Settings page allows admins to configure the Routerly service, notification channels, and view system information. It is only accessible to users with the admin role.
Open Settings from the Settings item in the sidebar.
General Tab
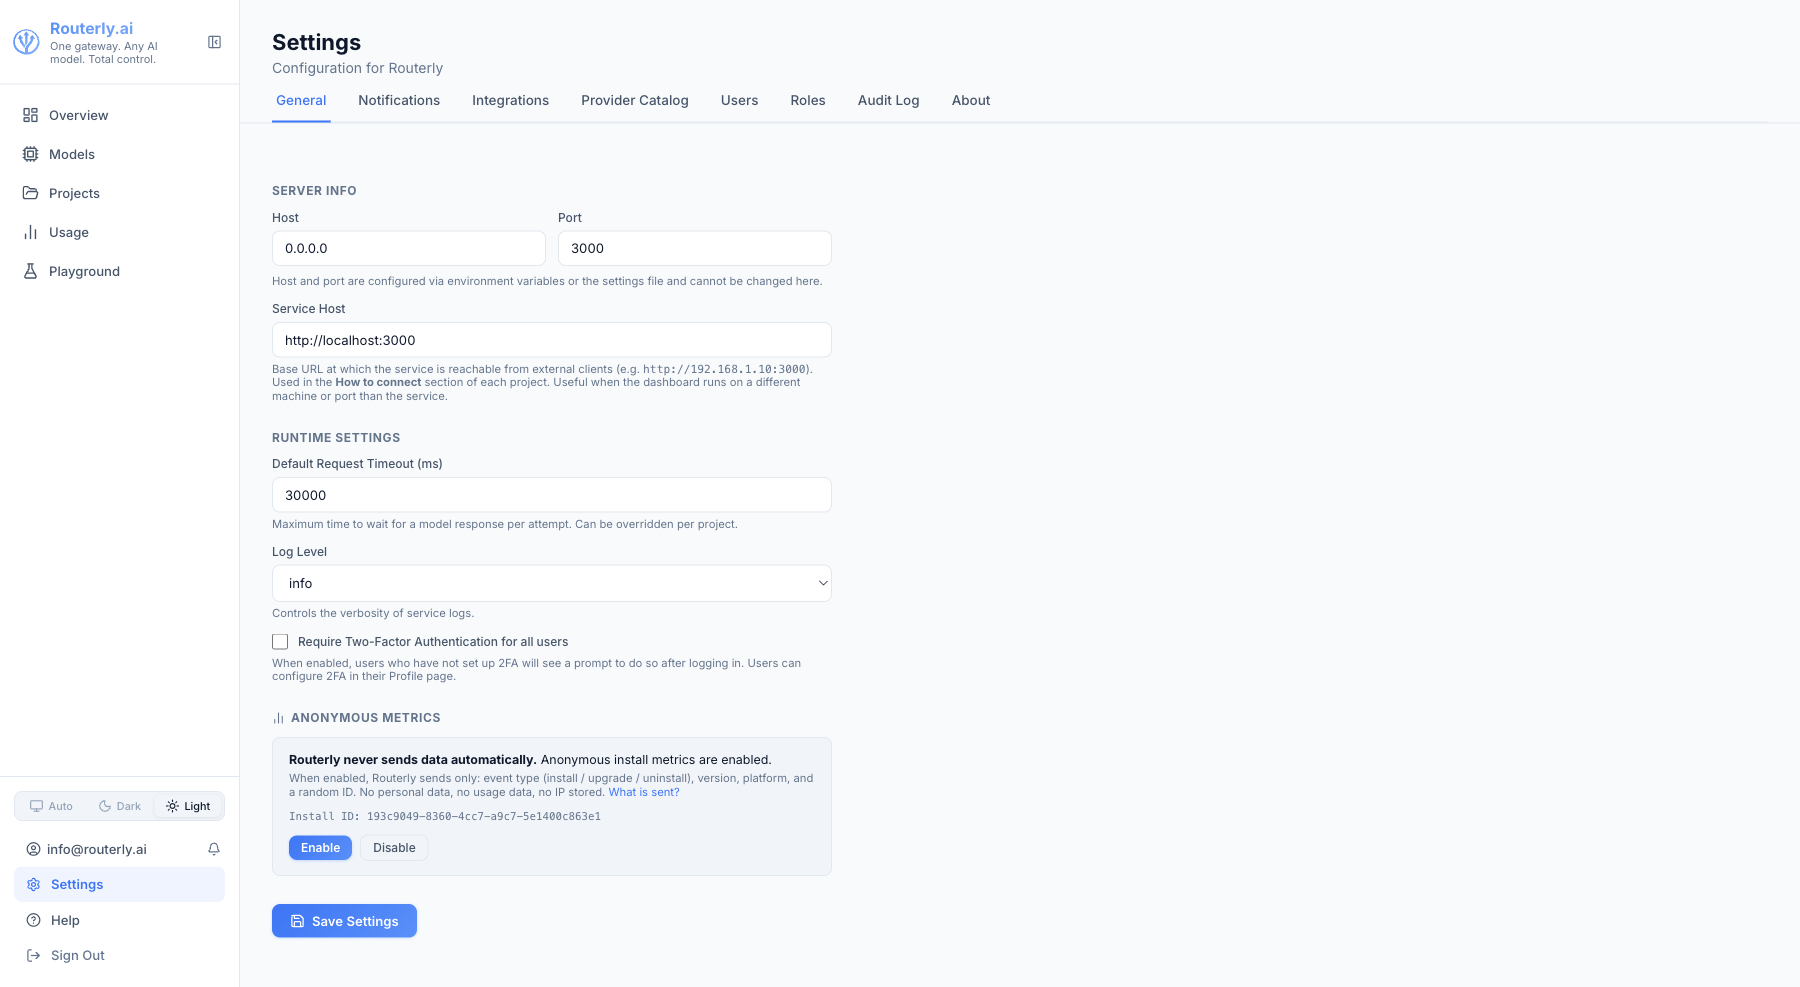
Service Configuration
| Field | Description |
|---|---|
| Port | The port the service listens on (read-only — change via CLI or environment variable) |
| Host | The bind address (read-only) |
| Public URL | The externally accessible URL of this Routerly instance. Shown in project connection snippets |
| Default Timeout | Per-request timeout in milliseconds (applies to all projects unless overridden per-project) |
| Log Level | trace / debug / info / warn / error |
| Dashboard Enabled | Toggle the web dashboard on or off |
Changes are saved immediately and take effect without a restart (except Port and Host, which require a restart).
Notifications Tab
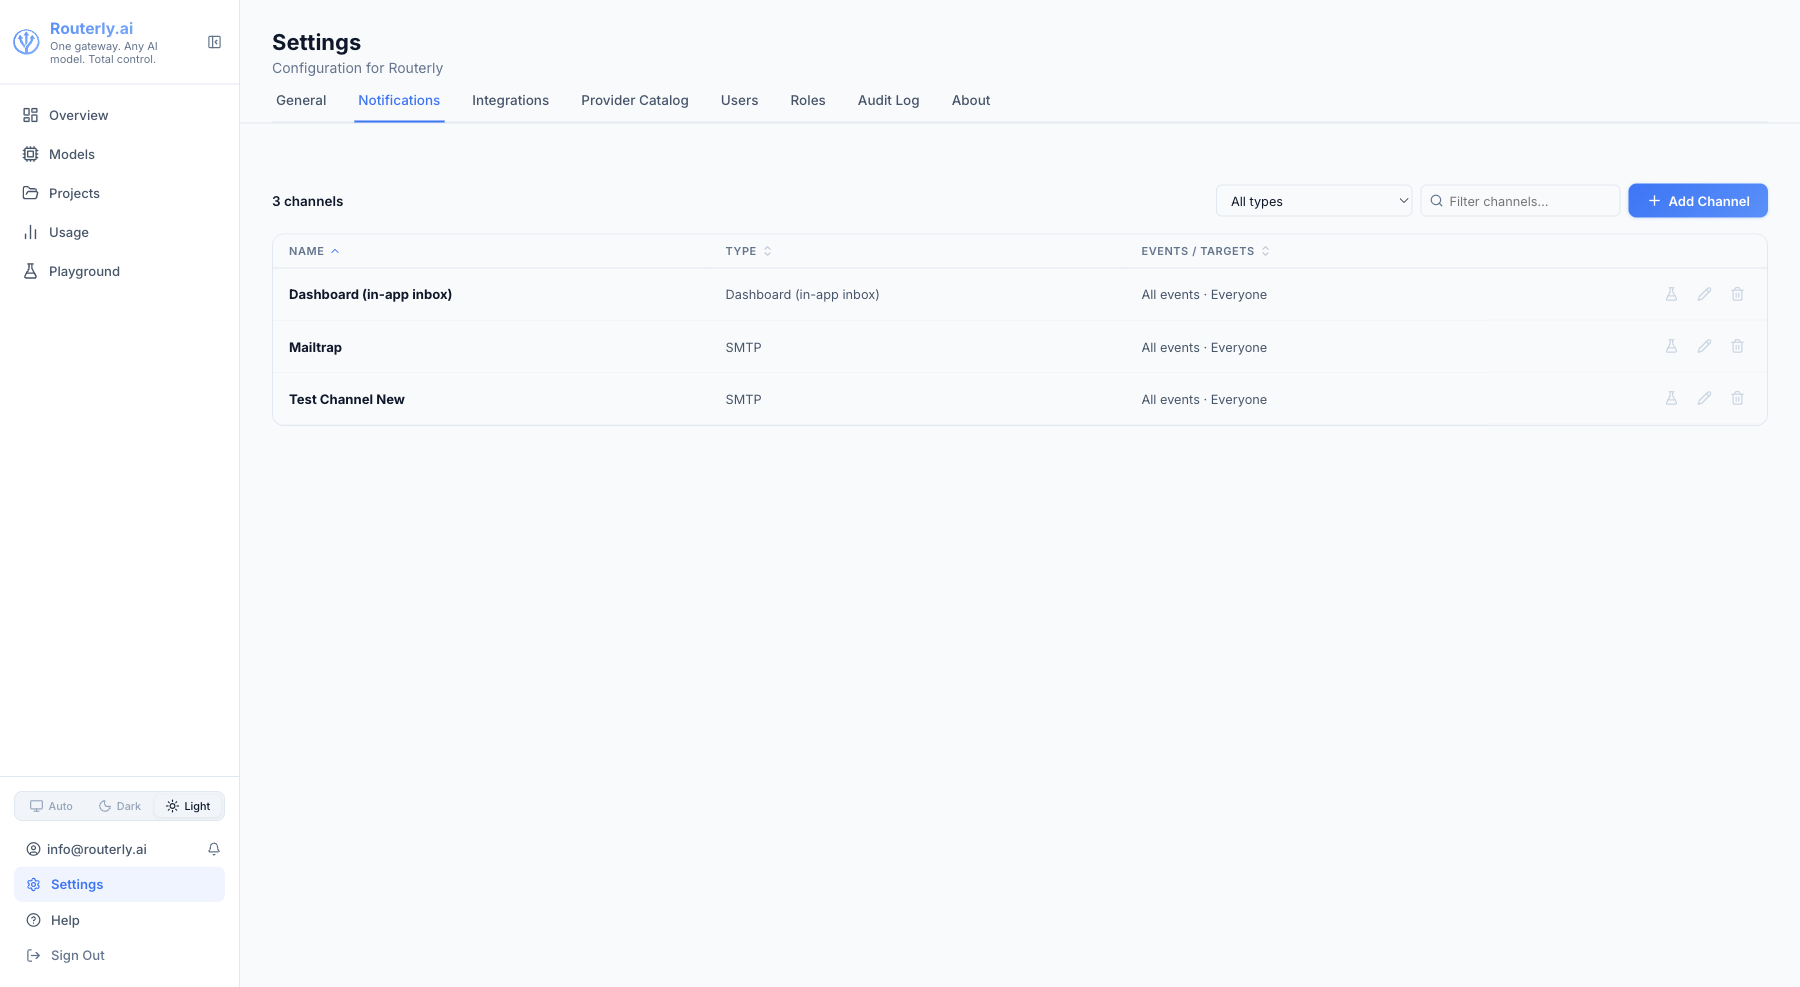
Configure notification channels. Each channel routes events to a delivery method (in-app inbox, email, or webhook) and can be scoped to specific event types and recipients.
The Notifications tab provides a channel management interface with a full list of configured channels and options to create, edit, test, and delete them.
Channel List
The list displays all configured channels in a table with:
- Name - friendly label
- Type - channel provider (Dashboard, SMTP, Slack, etc.)
- Events - event filter summary (shows first few patterns,
*= all) - Targets - target summary (role, permission, and user counts; empty = everyone)
- Actions - buttons to edit, test, and delete
Click a channel row to navigate to its edit page for detailed configuration.
Adding a Channel
- Click + Add Channel (or navigate to Settings > Notifications > New Channel)
- Select the channel type:
Dashboard,SMTP,SES,SendGrid,Azure,Google,Webhook,Slack,Teams,PagerDuty, orDiscord - Fill in the friendly Name and any required connection details:
- Dashboard: name only (no credentials)
- Email providers (SMTP, SES, SendGrid, Azure, Google): host, auth, from address
- Webhooks/Native (Webhook, Slack, Teams, PagerDuty, Discord): integration URLs and keys
- (Optional) Filter by Events - select specific event types to route to this channel; leave empty to receive all
- (Optional) Set Recipients / Targets - pick roles, permissions, or individual users; leave empty for everyone
- Click Create Channel
- Use Send Test to verify the channel works before relying on it for real events
See Concepts: Notifications for the full event taxonomy and per-type configuration fields.
Recipients / Targets control inbox visibility for the Dashboard channel and recipient resolution for email channels. Webhook and native channels (Slack, Teams, PagerDuty, Discord) deliver to a fixed endpoint - targets are stored but do not affect their delivery.
Editing a Channel
Click the channel row or the Edit button to open the edit page. You can change:
- Name - friendly label
- Events - event filter (leave empty for all)
- Recipients / Targets - audience filter
- Connection details - provider-specific fields (host, API keys, etc.). Secret fields (passwords, API keys, tokens) show as masked (
***) when present; clearing the field will leave it unchanged. To update a secret, re-enter it in the text field.
After making changes, click Update Channel to save.
Testing a Channel
On the channel list or edit page, click Send Test. Routerly sends a test message immediately. Check for a success toast or an error message with details about what went wrong.
For email-provider channels, you can optionally override the recipient email address before sending the test.
Removing a Channel
Click the Delete button on the channel row or edit page. You will be asked to confirm deletion.
Routing Rules
Routing rules map event patterns to one or more channels. When an event matches a rule's patterns, it is dispatched to the specified channels (in addition to any project-level overrides via the Notifications tab on the project page).
By default, events are not routed to any channels — they are only recorded in the inbox. Add a rule to enable routing.
Adding a Rule:
- Scroll to the Routing Rules section
- Click + Add Rule
- Select one or more Events from the dropdown (e.g.
Provider - Error,Budget - Threshold) - Select one or more Channels to route matching events to
- Click Add
The rule is applied immediately.
Event Patterns:
Rules support three pattern types:
- Exact name — e.g.
provider.error(matches only that event) - Wildcard —
*(matches all events) - Prefix glob — e.g.
budget.*(matchesbudget.threshold,budget.exhausted, etc.)
Removing a Rule:
Click the × icon next to a rule to delete it.
See Concepts: Notifications — Routing Rules for additional details.
Cooldowns
Cooldowns suppress repeated dispatches of the same event type within a specified interval. Suppressed events are still recorded in the inbox and logs; they are simply not sent to external channels.
This prevents alert fatigue when a system is repeatedly triggering the same issue.
Adding a Cooldown:
- Scroll to the Cooldowns section
- Click + Add Cooldown
- Select an Event from the dropdown (e.g.
Provider - Degraded) - Enter a Duration in format:
15m,1h,30s,2d(supportss/m/h/dsuffixes) - Click Add
The cooldown is applied immediately.
Removing a Cooldown:
Click the × icon next to a cooldown to delete it.
See Concepts: Notifications — Cooldowns for additional details.
Provider Catalog Tab
Configure the provider and model catalog repositories. Routerly fetches the catalog dynamically from one or more remote repositories at runtime, enabling rapid updates without service restarts.
The default catalog source is the official Inebrio repository. Add custom repositories to merge additional providers or override defaults.
Repository List
The table displays all configured repositories with the following columns:
- # — Priority (row order). Row 1 is checked first on merge conflict. Use arrow buttons to reorder.
- URL — Repository endpoint (clickable, opens in new tab)
- File — Filename of the last resolved catalog snapshot (or
—if never fetched) - Updated — Timestamp from the catalog registry, indicating when the snapshot was created (or
—) - Last Check — When Routerly last attempted to fetch from this repo (or
—if never checked) - Status —
Active(green) for enabled repos,Disabled(muted) for disabled repos, orError(red with tooltip showing details)
Reordering Repositories
Click the up/down arrow buttons on each row to change priority. The first repo in the list wins on merge conflict. Up arrow is disabled on row 1 (topmost); down arrow is disabled on the last row.
Editing a Repository
Click Edit to modify:
- URL — the repository endpoint (required)
- Enabled — checkbox to enable or disable the repo without removing it
Click Save to persist changes or Cancel to discard.
Removing a Repository
Click the Remove (trash icon) button to delete a repository from the list immediately. The default Inebrio repository cannot be removed.
Adding a Repository
- Scroll to the Add Repository form below the table
- Enter the repository URL (e.g.
https://your-org.com/catalog/) - Click Add Repository
The new repo is appended at the end of the list (lowest priority). Enable/disable or reorder as needed.
Refresh
Click the Refresh button in the top right to invalidate the 6-hour in-memory cache and fetch all enabled repositories immediately. The estimated next automatic refresh time is shown below the button. Useful after adding a new repo or when you know the catalog has been updated.
Integrations Tab
Export Routerly metrics to external monitoring and observability systems. Integrations push metrics every 60 seconds to your chosen platform.
Supports: Prometheus (pull), OpenTelemetry, Datadog, Grafana Cloud, InfluxDB, and Webhook.
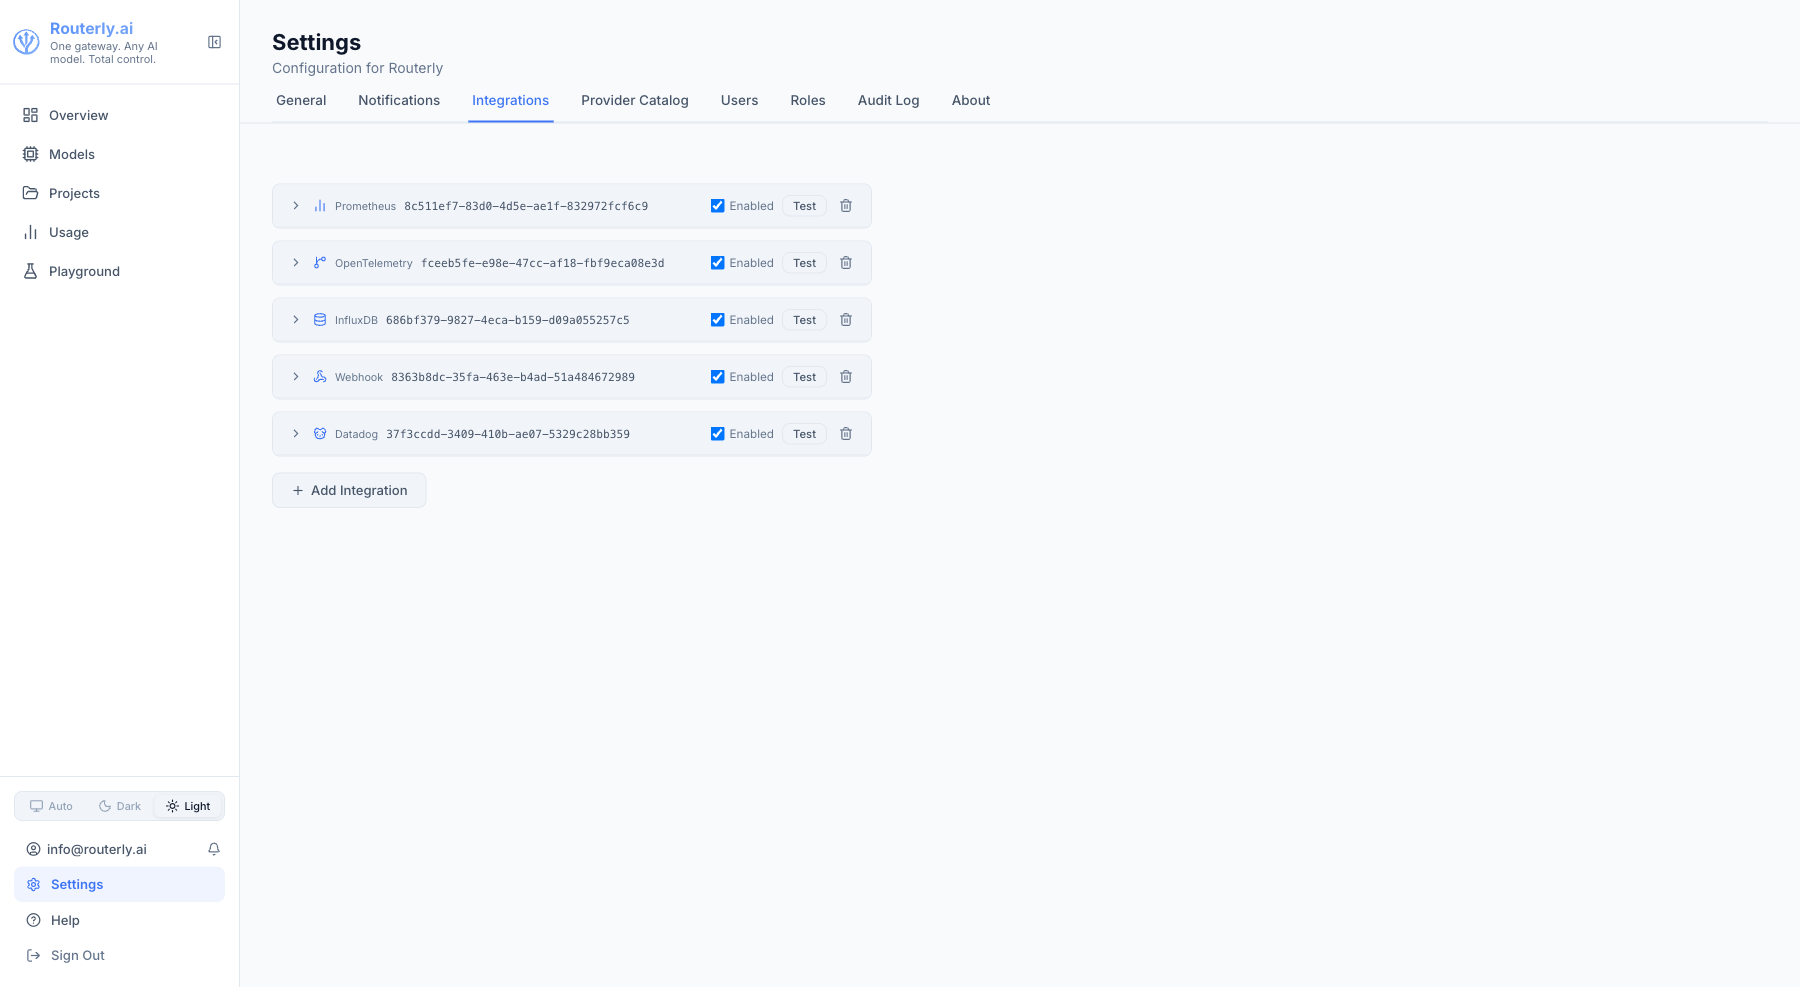
The Integrations tab provides a management interface with a list of configured integrations and options to create, edit, test, enable/disable, and delete them.
Integration List
The list displays all configured integrations in a table with:
- Name — friendly label
- Type — integration provider (Prometheus, Datadog, OpenTelemetry, etc.)
- Status — enabled/disabled toggle
- Details — endpoint, URL, or key identifier (truncated for readability)
- Actions — buttons to edit, test, and delete
Click a row to expand inline details (endpoint, protocol, headers, etc. depending on type).
Adding an Integration
-
Click + Add Integration to open the create form
-
Select the integration Type:
Prometheus,OpenTelemetry,Datadog,Grafana Cloud,InfluxDB, orWebhook -
Enter a friendly Name (e.g. "Production Datadog")
-
Fill in type-specific configuration:
Prometheus (pull-based, no push):
- Auth Token (optional) — if Routerly's
/metricsendpoint requires bearer authentication
OpenTelemetry (push):
- Endpoint URL (required) — e.g.
http://localhost:4318/v1/metrics - Protocol (required) —
httporgrpc - Headers (optional) — one per line, format
Key: Value(e.g.Authorization: Bearer token)
Datadog (push):
- API Key (required) — your Datadog API key
- Site (required) —
datadoghq.com(US East),datadoghq.eu(EU),us3.datadoghq.com,us5.datadoghq.com, orddog-gov.com
Grafana Cloud (push):
- Remote Write URL (required) — Prometheus remote_write endpoint from your Grafana Cloud instance
- Username (required) — numeric ID from Grafana Cloud
- API Key (required) — your Grafana Cloud API key
InfluxDB (push):
- URL (required) — e.g.
http://localhost:8086 - Token (required) — InfluxDB API token
- Organization (required) — org name in InfluxDB
- Bucket (required) — target bucket for metrics
Webhook (push):
- URL (required) — HTTPS endpoint to receive metric POST requests
- Secret (optional) — if set, Routerly signs each request with HMAC-SHA256 in the
X-Routerly-Signatureheader - Headers (optional) — custom headers to include with each request
- Auth Token (optional) — if Routerly's
-
Check the Enabled toggle to activate immediately upon creation
-
Click Create Integration
-
Use Test to verify connectivity before relying on it for production metrics
Editing an Integration
Click the Edit button on an integration row to open the edit page. You can change:
- Name — friendly label
- Enabled toggle — pause/resume without deleting
- Type-specific config — provider credentials and settings. Secret fields (API keys, tokens, auth token, secret) show as masked (
***) when present; clearing the field will leave it unchanged. To update a secret, re-enter it in the text field.
After making changes, click Update Integration to save.
Testing an Integration
On the list or edit page, click Test. Routerly verifies connectivity to the external system and sends a test request if applicable.
- Prometheus — test is a no-op (always succeeds; Prometheus pulls metrics from
/metrics, so outbound connectivity is not checked) - Push types — sends a real metrics payload and returns success or error details
A toast notification shows the result immediately.
Enabling and Disabling
Use the Enabled toggle on the list view to pause metric export to an integration without deleting it. Disabled integrations do not receive metric pushes.
Removing an Integration
Click the Delete button on a row. You will be asked to confirm deletion.
Metrics Exported
All push-type integrations (OpenTelemetry, Datadog, Grafana, InfluxDB, Webhook) receive the same metrics every 60 seconds:
| Metric | Type | Dimensions | Description |
|---|---|---|---|
routerly_requests_total | Counter | project, model | Total request count by project and model |
routerly_tokens_total | Counter | type (input/output), project, model | Total tokens consumed |
routerly_cost_usd_total | Gauge | project, model | Estimated USD cost by project and model |
routerly_request_duration_p50_ms | Gauge | project | Median request latency per project |
routerly_request_duration_p95_ms | Gauge | project | 95th percentile latency per project |
routerly_budget_used_ratio | Gauge | project | Budget consumption ratio (0–1) per project |
Each platform receives metrics in its native format:
- OpenTelemetry — OTLP JSON or gRPC
- Datadog — Datadog Series API v2
- Grafana — Prometheus remote_write format
- InfluxDB — InfluxDB v2 line protocol
- Webhook — JSON POST with metric snapshot
About Tab
Application
System information about the running instance:
| Field | Description |
|---|---|
| Version | Routerly version string |
| Channel | Active update channel: latest, stable, develop, or a pinned version tag. Editable — see Update Channel below |
| Uptime | How long the service has been running since last start |
| Node.js | Node.js runtime version |
| Platform | OS and architecture |
| Config Directory | Path to ~/.routerly/config/ (or $ROUTERLY_HOME/config/) |
Update Channel
The channel selector lets you choose which release stream Routerly follows when checking for updates:
| Channel | Description |
|---|---|
latest | Most recent release (may include pre-releases) |
stable | Most recent production-stable release |
develop | Development pre-release builds |
| Custom version | Pin to a specific release tag (e.g. v0.2.0) |
Changing the channel takes effect immediately — the running service is notified without a restart.
To enter a specific version tag, select Custom… in the dropdown. Type the tag (e.g. v0.2.0) and click Apply.
You can also change the channel from the CLI:
routerly update channel stable
routerly update channel v0.2.0
Software Update
Shows the current update status for the active channel. The service checks for new releases automatically every 24 hours.
| Field | Description |
|---|---|
| Current version | The version currently running |
| Available version | The latest version on the active channel, or "Up to date" if already current |
| Last checked | Timestamp of the most recent check against the GitHub Releases API |
Check for updates forces an immediate check against the GitHub Releases API and refreshes the displayed result.
Update to vX.Y.Z — visible only when a newer version is available on the current channel and the service is not running inside Docker. Clicking it triggers an in-app update:
- The service downloads and runs the installer for the new version in the background
- The service restarts automatically
- The dashboard reloads once the service is back online (polled every 3 seconds, up to 60 seconds)
In-app update is disabled when Routerly is running inside a Docker container. Pull the new image and recreate the container instead:
docker pull inebrio/routerly:latest
docker compose up -d
Admin Update Banner
When a newer version is available on the active channel, a yellow banner appears at the top of every page for admin users. The banner links to this page and can be dismissed for the current browser session by clicking ×.
Audit Log
Settings → Audit Log
The Audit Log records every write operation performed on the Routerly instance: who did what, when, and whether it succeeded or was blocked.
What is recorded
| Event | Trigger |
|---|---|
model:create/update/delete | Model added, edited, or removed |
project:create/update/delete | Project added, edited, or removed |
user:create/update/delete | User added, edited, or removed |
role:create/update/delete | Role added, edited, or removed |
token:create/delete | API token issued or revoked |
settings:update | Global settings changed |
forbidden | Any action blocked by missing permission |
Filters
- Period — date range picker with presets (today, last 7 days, this month, etc.)
- User — filter by email or user ID
- Action — filter by action substring (e.g.
model:create) - Result — toggle between All / Success / Forbidden / Error
Results are paginated (50 entries per page), server-side.
Retention
Entries older than 90 days are automatically pruned. Maximum 10,000 entries are kept at any time.
Access control
Requires audit:read permission. Assign this permission to roles that should have read-only access to the audit trail (e.g. a dedicated "Auditor" role).